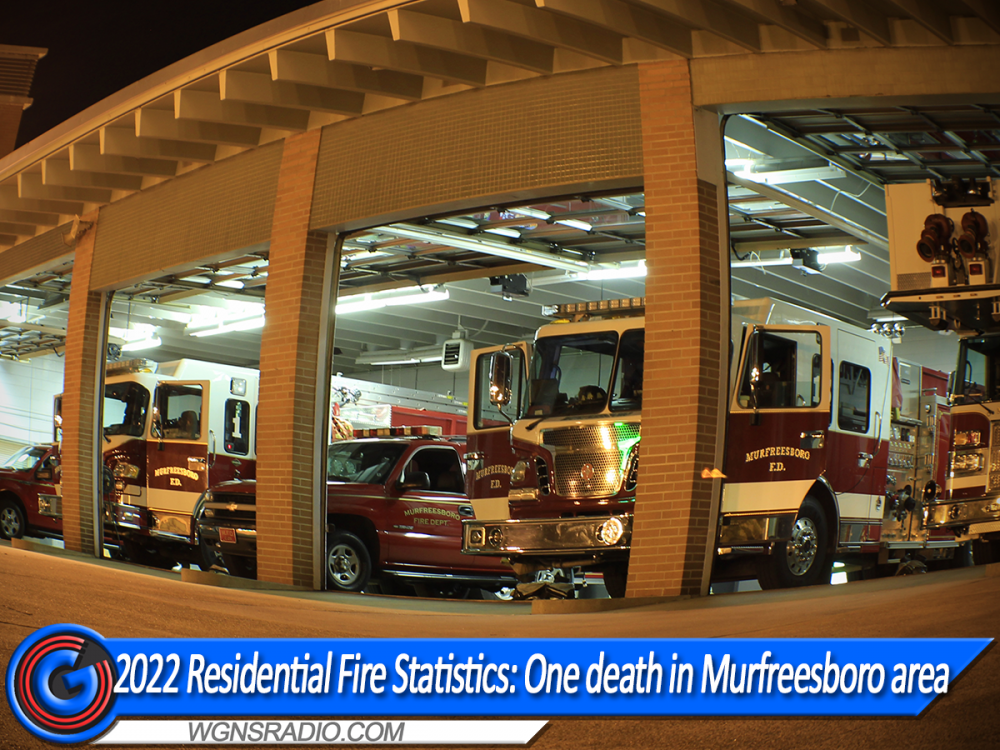
There has been a spike in fire calls that involve smokers and oxygen tanks. Murfreesboro Assistant Chief Brian Lowe said he recently confirmed with the fire marshal's office...
Lowe reminded residents...
Increased oxygen in a home can make things that are easily flammable – catch on fire even quicker...
Between January 1, 2022 and Monday - April 11, 2022, there has only been one residential fire death recorded in Rutherford County. In that case, the death occured in a Murfreesboro fire on Feb. 27, 2022. The fire took place on Isis Court and remains under investigation at this time, however - it was confirmed that medical oxygen tanks were in the home at the time of the blaze.
There was a total of 343 fires in the Murfreesboro area last year. The fire department hopes to greatly reduce that number throughout 2022 by further educating residents about fire hazards. Understanding the danger of mixing medical grade oxygen with smoking is one of many steps in that educational process.
Scroll down for information and data...
Fire Data in Tennessee - Continued...
So far this year in Tennessee, there have been 29-civilian home fire fatalities and 2-firefighter deaths (2022). Last year in 2021, there were a total of 57-civilian deaths in residential fires occurring throughout the state of Tennessee. Between 1990 and 2021, there have been 69 on-duty firefighter fatalities in Tennessee.
Looking at statewide data, there are 4.6 deaths per every 1,000 fires in Tennessee and 9.1 injuries per every 1,000 fires. The national average is 2.6 deaths per every 1,000 fires and 10-injuries per every 1,000 fires nationwide, according to the National Fire Incident Reporting System (NFIRS, 2019 data).
When focusing solely on fires inside homes or apartment buildings statewide, there were 14.4 deaths per every 1,000 residential fires and 25.6 injuries per every 1,000 residential fires in the Volunteer State. The National average stands at 6.2 deaths and 25.6 injuries per every 1,000 residential fires (NFIRS) See more data here.
|
Tennessee Fire Call (Type) |
Percent |
|
Emergency medical services (EMS) |
62.5% |
|
Good intent |
13.1% |
|
False alarms |
9.1% |
|
Service calls |
7.1% |
|
Fires |
4.8% |
|
Hazards |
2.8% |
|
Other |
0.3% |
|
Explosions |
0.2% |
|
Weather |
0.2% |
|
Table may not total 100 percent due to rounding (NFIRS Data) |
|


