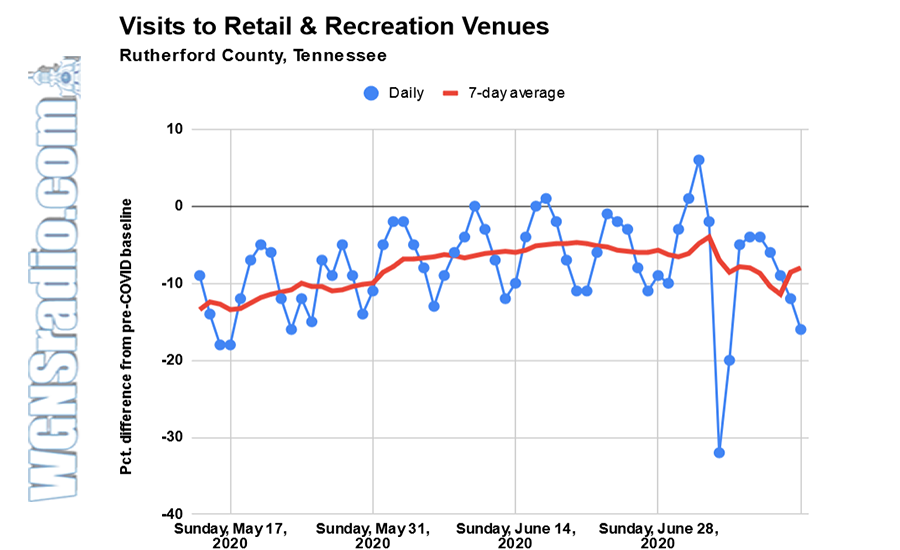
MURFREESBORO, Tenn. — Data analysis by a Middle Tennessee State University professor suggests that Fourth of July weekend preparations brought a substantial, but short-lived, boost in visits to retail shops and restaurants as the state continues grappling with how best to contain the spread of the novel coronavirus.
Ken Blake, Ph.D., an MTSU data journalism professor who has been analyzing trends in Google's Community Mobility Reports, said tracking data from Google for metro areas in Tennessee suggests that retail and eating establishments have yet to see a stable return of the customer traffic they were enjoying before the COVID-19 outbreak.
In Shelby, Knox, Hamilton and Rutherford counties, trips to retail and dining venues on July 2, a Thursday, peeked above levels generally not seen since January and early February, before the growing coronavirus pandemic led to closures, quarantines and pleas for social distancing across the state.
The Tennessee Department of Health reported the state has reached 71,400-plus total cases as of Thursday, with 796 deaths statewide and approximately 29,500 active cases. The state’s number of COVID-19 cases has spiked significantly in recent weeks following Gov. Bill Lee’s decision to begin reopening the state’s economy and lifting previous coronavirus restrictions in late June.
"In terms of customer traffic, the run-up to the Fourth marked some of the best days shops and restaurants in Tennessee metro areas have seen since the lockdowns," said Blake. "Even in Davidson and Williamson counties, where traffic has remained well below pre-outbreak levels, visits to shops and restaurants just before the Fourth got within sight of something like normal."
But the jumps appear to have been temporary, Blake said. After plummeting on July Fourth — understandable for a holiday — traffic returned to levels below those from before the outbreak, Blake said.
"The data can't tell us why traffic is staying relatively low, unfortunately," Blake said. "The recession, high unemployment, spikes in daily counts of new COVID-19 cases, and continued or renewed restrictions are almost certainly playing a role. It may also be true that retail and restaurant traffic always sags in July, virus or no virus. We have no corresponding data from last July to compare the current numbers against."
Blake said another week or two of data should yield a clearer picture of whether July's retail and recreation traffic will be similar to June's or markedly different.
Google derives the data from aggregated, anonymized information gathered about Google users who have turned on the location history setting in their Google accounts.
Values in the data compare current visits to various type of locations against a baseline established from data for Jan. 3 through Feb. 6, 2020. Updated regularly, with a lag of at least a few days, the data is available down to the county level at https://www.google.com/covid19/mobility/. Blake has been analyzing the raw data, but state and county summary reports are available for download on the site.
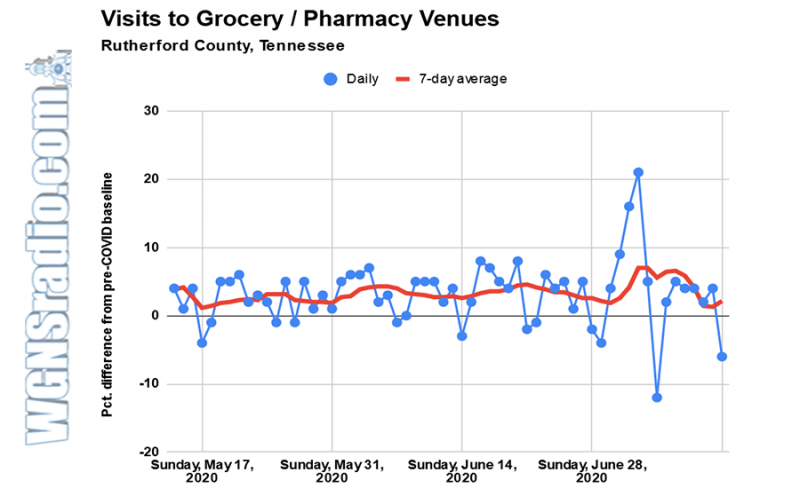
The data show that, generally, visits to grocery stores and pharmacies have remained at or near pre-COVID levels, while visits to work locations have remained far lower as many companies are still allowing remote work for their employees where feasible and other workers have been forced to the unemployment rolls. The amount of time people are spending at home has remained far higher than before the outbreak, too, Blake said.
"We're staying home more instead of going to work, either because we are working from home or not working at all," Blake said. "And judging from how often we're going to the grocery store, it looks like we're eating a lot of home-cooked meals."
Metro Nashville recently scaled back its phased reopening plans in light of the recent case spike and implemented mandatory masks or face coverings in public. A handful of other counties, including Shelby, have issued similar mask orders after Lee gave county mayors the discretion to do so earlier this month.
Below are charts showing retail and recreation traffic between May 12 and this past Sunday for each of several selected Tennessee counties. Interactive versions of the charts, as well raw data and charts for visits to other types of venues, are available at: https://tinyurl.com/yav8tjo7.


